To help you understand the context surrounding your insights, you can add markers. Markers reflect significant events that could be potential catalysts for issues, such as new deployments, rollbacks, and specific alerts that may have been triggered.
Markers are based on actual log messages coming in to Layerlog. When the conditions of a marker’s search query are met, a marker is added to your insights.
To add a marker
Configure your log message
Configure your system to log a specific message that will serve as your marker’s trigger.
Run a test query in Kibana, and make sure your query returned the expected results.
Create the marker
Below the Insights chart, click Markers, and then click Create marker
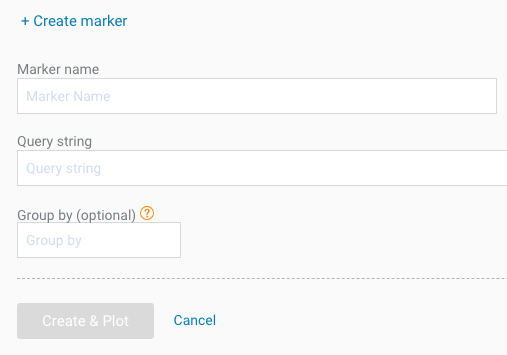
Assign a Marker name. Then type your Query string that you tested in step 1, and click Create & Plot.
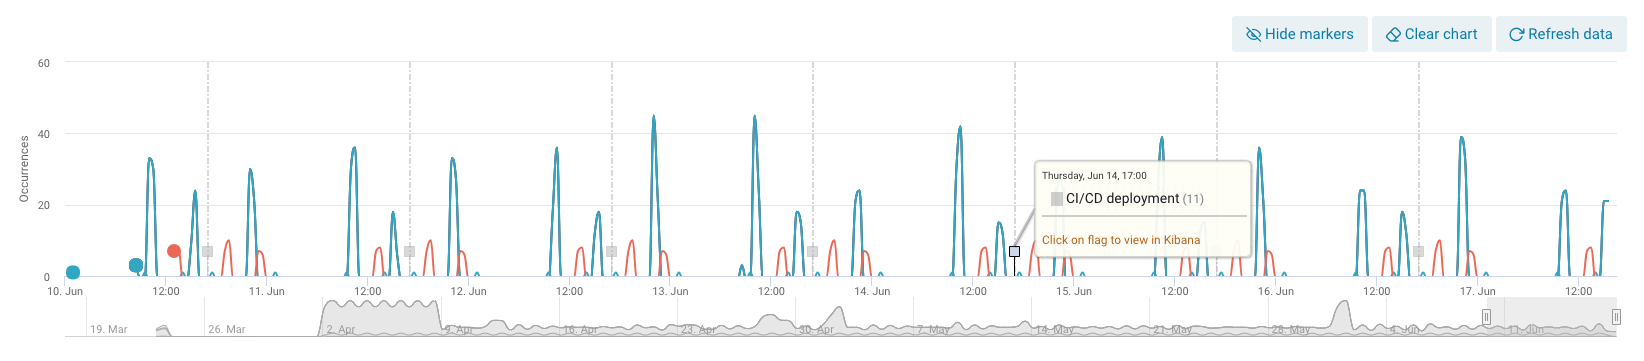
When the conditions of the marker are met, it will appear in the insights chart as a gray box and a dotted line. You can use this marker to see the relationship between insights and system events.

Click a marker in the insights chart to view it in Kibana.