Layerlog Service Performance Monitoring dashboard provides an overview of your systems’ health by aggregating Request, Error, and Duration (R.E.D) metrics from span data. The dashboard helps you to pinpoint and isolate incidents in your system quickly.
The following guide helps you configure the OpenTelemetry collector to extract metrics from spans generated from your application instrumentation, and send them to Layerlog. Once configured and deployed, the collector accepts the spans and processes them through two pipelines:
The first pipeline sends the spans to the Layerlog backend, where you can analyze single traces and focus on slowness and bottlenecks. The second pipeline extracts the metrics from the same spans, aggregates them and sends them to Layerlog’s Prometheus-based account.
Prerequisite for Service Performance Monitoring dashboard
To get started with your very own dashboard, you’ll need the following:
- Admin permissions in an active Layerlog Tracing account
- An active Metrics plan with Layerlog (That’s connected to your Tracing account, as detailed in the next section)
- An application instrumented with an OpenTelemetry installation
Create a Metrics account
To get started with your Service Performance Monitoring dashboard, you’ll first need to create a Metrics account.
Navigate to Manage accounts, scroll down to find the Metrics account plan, and click Add a Metrics account.
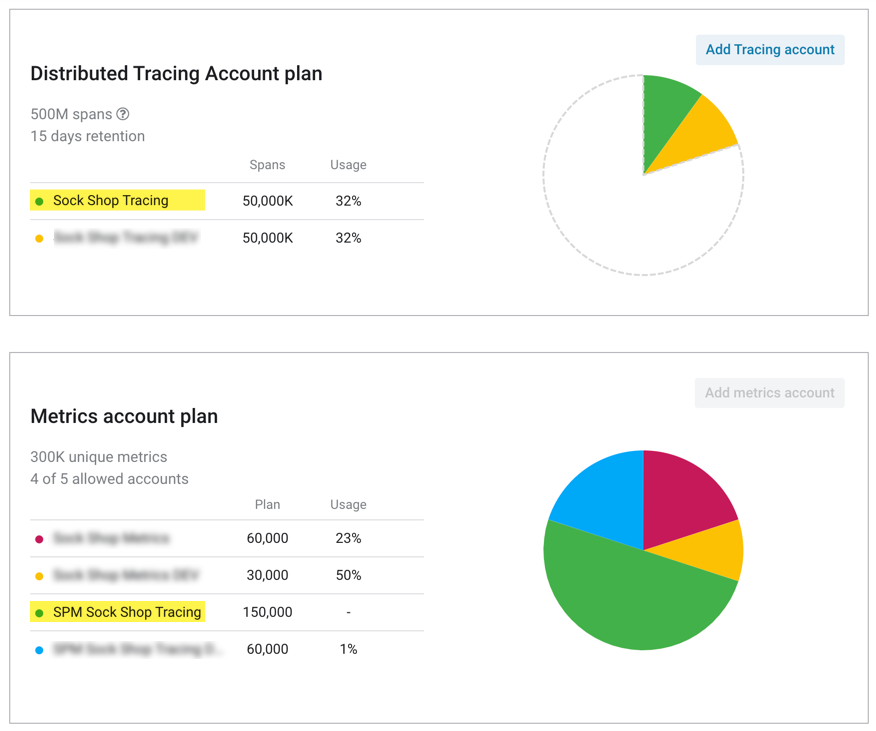
The Metrics account name must contain the name of the matching Tracing account. For example, if your Tracing account is called Sock Shop Tracing, the connected Metrics account can be SPM Sock Shop Tracing.
Add Layerlog exporter to your OpenTelemetry collector
To set up your locally hosted OpenTelemetry installation to send traces to Layerlog, add the following parameters to the configuration file of your OpenTelemetry collector:
- Under the
receiverslist:
otlp/spanmetrics:
    protocols:
      grpc:
        endpoint: :12345
  prometheus:
    config:
      global:
        external_labels:
          p8s_logzio_name: <<CHOOSE-LABEL-NAME>>
      scrape_configs:
      - job_name: 'atm'
        scrape_interval: 15s
        static_configs:
        - targets: [ "0.0.0.0:8889" ]
- Under the
exporterslist:
prometheusremotewrite:
    endpoint: https://<<LISTENER-HOST>>:8053 # Replace with the Layerlog Listener URL for your region, configured to use port 8052 for http traffic, or port 8053 for https traffic. https://docs.layerlog.com/user-guide/accounts/account-region.html#available-regions
    headers:
      Authorization: Bearer <<PROMETHEUS-METRICS-SHIPPING-TOKEN>> # Replace with your Metrics token http://panel.layerlog.com/#/dashboard/settings/manage-tokens/data-shipping?product=metrics
  prometheus:
    endpoint: "localhost:8889"
- Under the
processorslist:
spanmetrics:
    metrics_exporter: prometheus
    latency_histogram_buckets: [2ms, 6ms, 10ms, 100ms, 250ms, 500ms, 1000ms, 10000ms, 100000ms, 1000000ms] #These are suggested latency buckets. You can configure the latency bucket to fit your data
    # Additional list of dimensions on top of:
    # - service.name
    # - operation
    # - span.kind
    # - status.code
    dimensions:
      # If the span is missing http.method, the processor will insert
      # the http.method dimension with value 'GET'.
      # For example, in the following scenario, http.method is not present in a span and so will be added as a dimension to the metric with value "GET":
      # - promexample_calls{http_method="GET",operation="/Address",service_name="shippingservice", span_kind="SPAN_KIND_SERVER",status_code="STATUS_CODE_UNSET"} 1
      - name: http.method
        default: GET
      # If a default is not provided, the http.status_code dimension will be omitted
      # if the span does not contain http.status_code.
      # For example, consider a scenario with two spans, one span having http.status_code=200 and another missing http.status_code. Two metrics would result with this configuration, one with the http_status_code omitted and the other included:
      # - promexample_calls{http_status_code="200",operation="/Address",service_name="shippingservice", span_kind="SPAN_KIND_SERVER",status_code="STATUS_CODE_UNSET"} 1
      # - promexample_calls{operation="/Address",service_name="shippingservice", span_kind="SPAN_KIND_SERVER",status_code="STATUS_CODE_UNSET"} 1
      - name: http.status_code
- Under the
service: pipelineslist:
  metrics/spanmetrics:
      # This receiver is just a dummy and never used.
      # Added to pass validation requiring at least one receiver in a pipeline.
      receivers: [otlp/spanmetrics]
      exporters: [prometheus]
Start the collector
To deploy via Docker or Kubernetes, contact Layerlog Support team.
Deploy the integration and start sending traces from your OpenTelemetry installation to Layerlog.
Before deploying, make sure the collector you’re using is version v0.44.0 and up.
- Deploy via Local host
Run the application
Run the application to generate traces.
Check Layerlog for your metrics
Give your metrics some time to get from your system to ours, then navigate to Tracing > Monitor and view your aggregated metrics for your services and operations.