Your Logs account has a daily quota to help you manage and monitor your logs and usage. To better understand your logs and their volume, you can create a visualization based on your log size. Follow these steps to create your LogSize visualization:
Enabling LogSize
Only account admins can enable saving log size. However, once enabled, all account users can use LogSize.
Kibana doesn’t recognize LogSize as a number right away, and you’ll need to enable it to create your visualization.
Navigate to Manage accounts and click on your main logs account. Then, click on Advanced options and tick the Save log size option.

Account utilization metrics and log size are set per individual account. This page is available only from your main account — you won’t be able to make this change from a sub account.
Navigate to your main Kibana dashboard. Next, click on Refresh mapping to view the added field called LogSize. This field contains the size of the log line in bytes, taken as a single string.
Creating LogSize visualization
Once LogSize is enabled, you can create your LogSize visualization.
Navigate to Logs > Visualize > Create visualization > Vertical bar. Search for logzioCustomerIndex and choose it as your source.
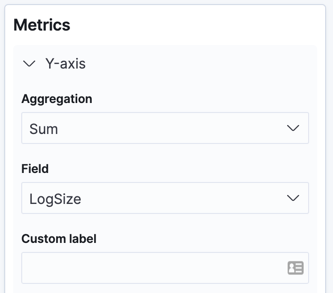
Click on Y-axis.
- Choose Sum as the aggregation
- Choose LogSize as the field.
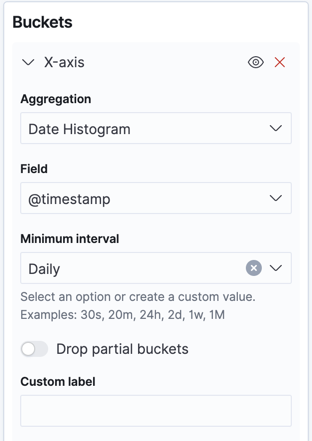
Click on Add under Buckets and choose X-axis.
- Select Date Histogram as the aggregation
- Select @timestamp as the field
- Change the minimum interval based on the output you’d like to view. In this example, we used the Auto interval.
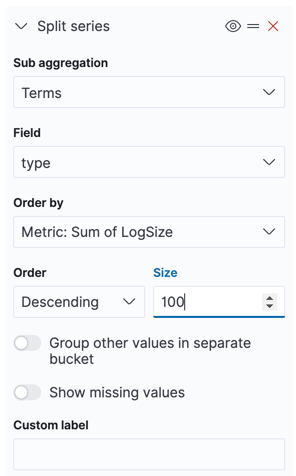
Click on Add, and choose Split series.
- Select Terms as the sub aggregation
- Select type as field
- Change the size based on your preferences. In this example, we changed it to 100.
You can modify the aggregations, intervals, and types based on the data suitable to your visualization needs. For example, if you’re using Kubernetes, you can view LogSize per service, container ID, etc.
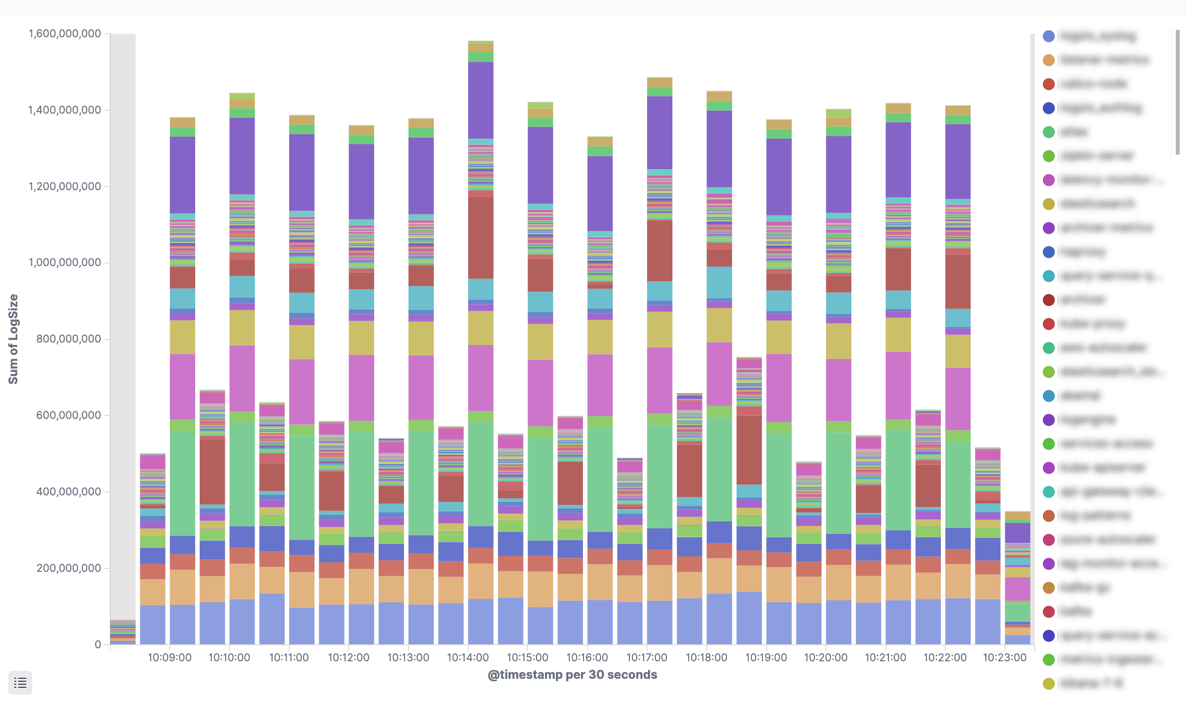
Click Apply changes to generate your visualization.
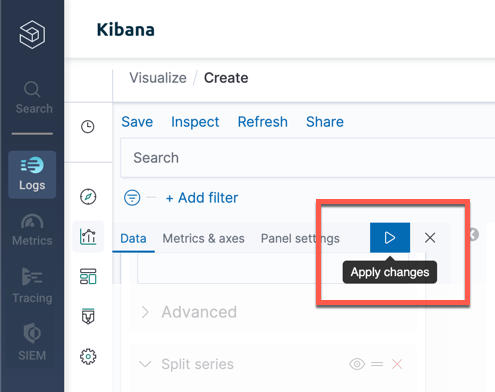
Your LogSize visualization is ready. It includes the different logs and their sizes based on the date range you’ve chosen.
You can edit the fields to investigate further, and Save or Share it with your teammates.